Chart Annotations (v2.0.7.0 )
Turbo-Chart Annotations Update
The v2.0.7.0 update of Turbo-Chart sees improvements to the functionality of annotations on charts. Below is an overview of Turbo-Chart annotations and the new updates.
Turbo-Chart Annotations Overview
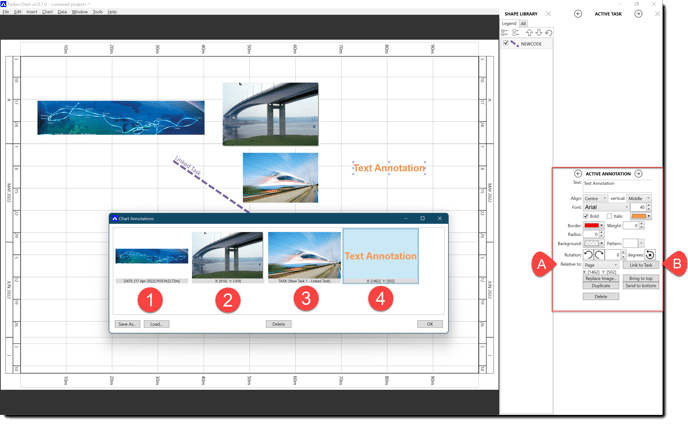
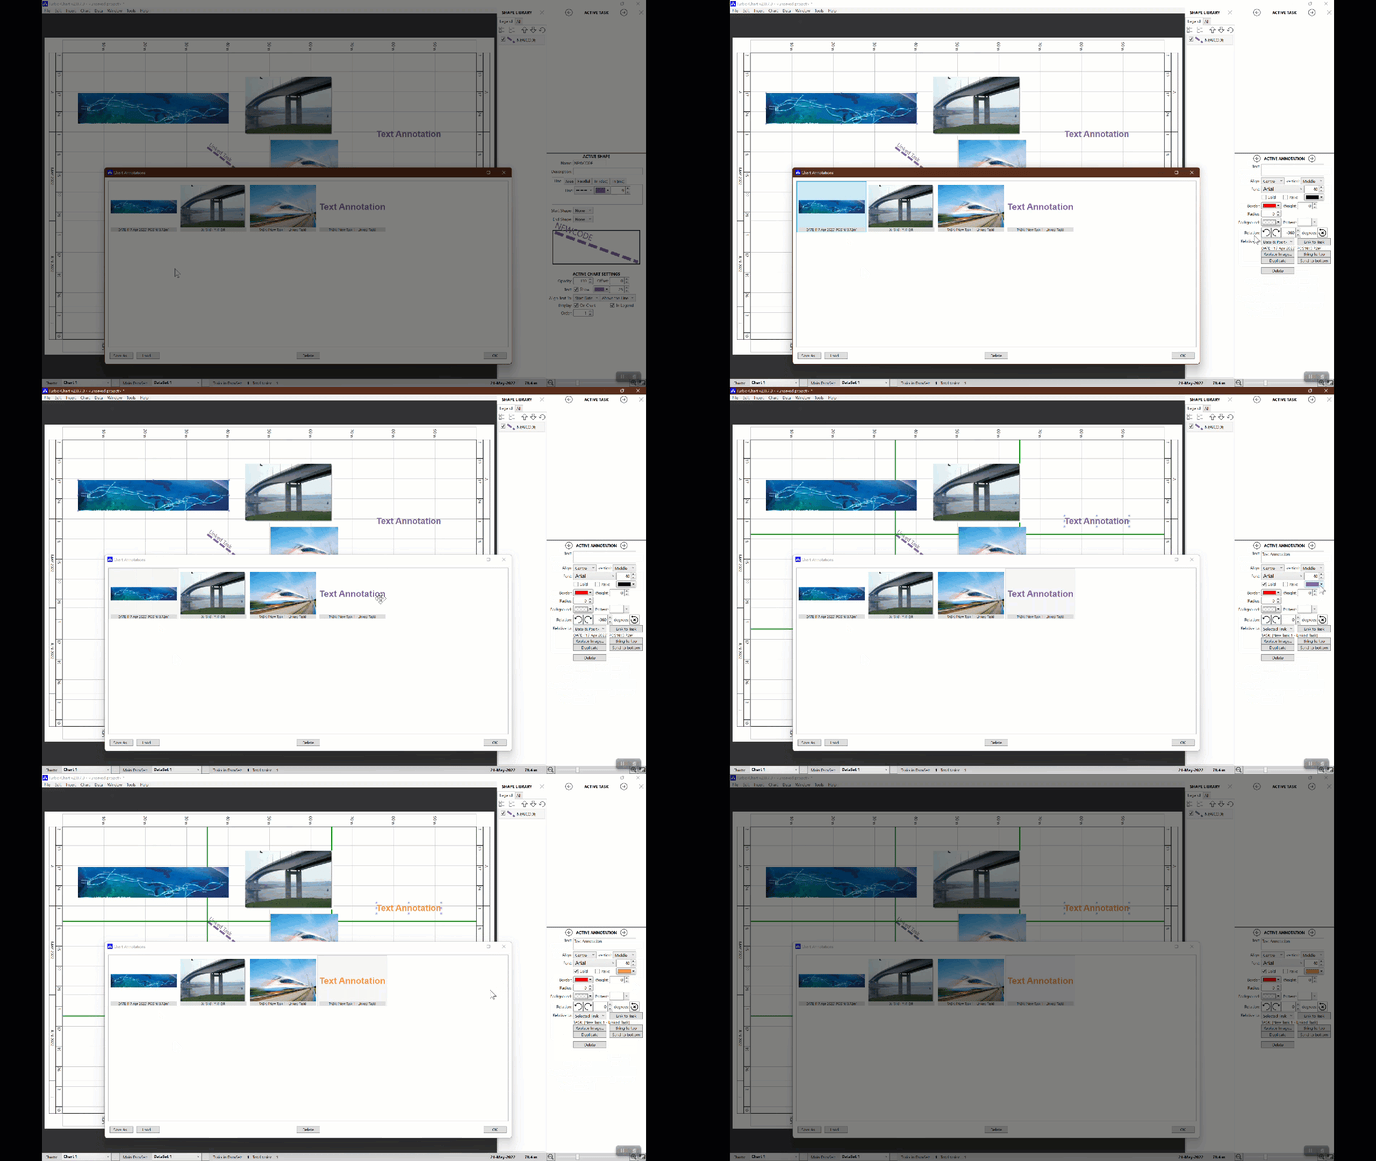
Annotations are graphics or text placed onto charts to provide additional contextual information, in addition to tasks and their Shape Codes. Note that each chart in Turbo-Chart contains its own set of Annotations, and if a chart is duplicated, all annotations are duplicated also. When an annotation is selected, the Active Annotation pane becomes active in the bottom right of screen, shown as the area highlighted around (A) and (B) in the image below.
Graphical annotations can be added to any chart by any of the following:
- Selecting INSERT>CUSTOM IMAGE from the menu and selecting a graphic file
- Clicking on an existing graphic annotation and duplicating it
- Copying an external image (for example from MS Powerpoint) and pasting into Turbo-Chart (by clicking CTRL+V)
Text annotation can be added to any chart using any of the following:
- Selecting INSERT > TEXT BOX from the menu and entering the text to be displayed
- Clicking on an existing text annotation and duplicating it
- Copying any external text (for example from a text editor) and pasting into Turbo-Chart (by clicking CTRL+V)
- Converting a Task Description to a Text Annotation by selecting a Task and pressing on the “Text” box, explained further below
All annotations on a chart are set as one of the following:
- Page Annotations are fixed to a point on the chart, if the date or location axes is modified, the annotation will remain in that same positions
- Date and Position Annotations are fixed to a specific date and location, they will shift relatively when the date or location axes are modified
- Linked to Task Annotations are positioned relative to a specified task, if the task changes its date or location, the annotation also shifts relatively.
A list of all annotations on a page can be viewed by selecting CHART>ANNOTATIONS from the menu. An annotation can be converted to any of the above by selecting it on the chart, or in the chart annotation window, and selecting the option (A) as shown in the image below.
Linking an annotation to a task is done by selecting the annotation, then setting the annotation type to “Selected Task” and then clicking on “Link to Task” (B) in the image below, and then selecting the task on the chart.
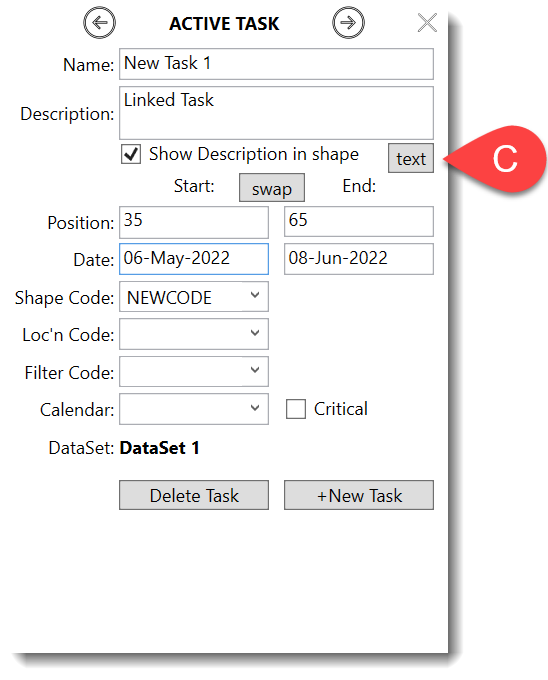
Converting a task description to an annotation is done by selecting the task on the chart (or from the DATA>TASKS list) and then pressing the “Text” button in the active shape pane, shown as (C) in the image to the right. This automatically creates a text annotation that is linked to the task. Note that the text annotation will not update if the task description is updated.
Release v2.0.7.0 of Turbo-Chart improves the behaviour of annotations with the following:
1. The Chart Annotations dialog now also displays information about each annotation.
- Date and Time Annotations now indicate the date and location of the annotation
- Page Annotations now specify the coordinates of the annotation on the chart
- Linked to Task annotations now indicate the linked task ID and Description
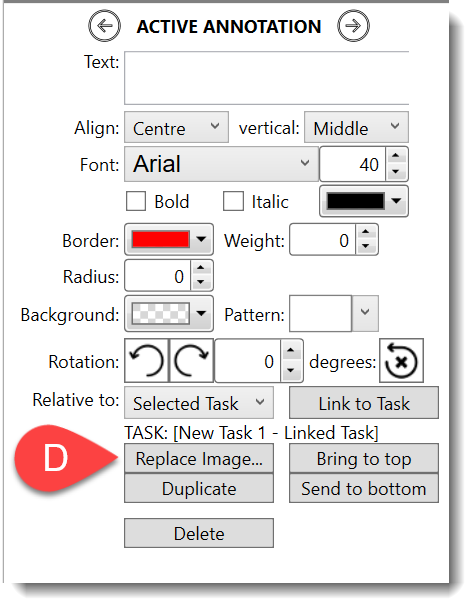
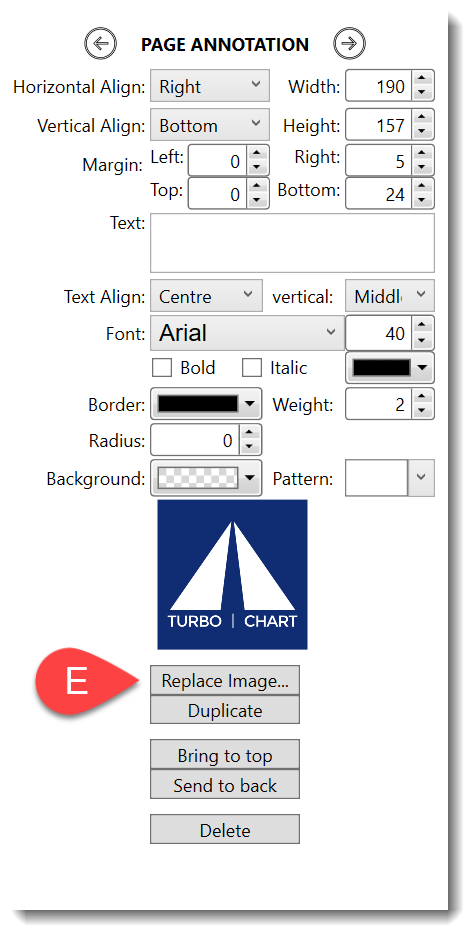
3. Graphical Annotations (or even Text Annotations) can have their images replaced, rather than previously needing to be deleted and added again. Select the Graphical annotation and press the Replace Image button, shown in (D) below, in the active annotation pane. Graphics in Page Layouts (FILE>PAGE LAYOUT from the menu) can also be replaced by selecting the graphic and pressing “Replace Image” on the Page Annotation pane, shown in (E) below.
