Turbo-Chart Highlighters Update
The v2.0.7.1 update of Turbo-Chart sees improvements to chart highlighters. Below is an overview of Turbo-Chart annotations and the new updates.
Turbo-Chart Highlighters Overview
Highlighters are used to provide additional information on the Time Location Charts to highlight specific dates or locations. Turbo-Chart can draw highlighters across the full width of a chart as lines or regions/bands to indicate the position of key location points, or key dates.
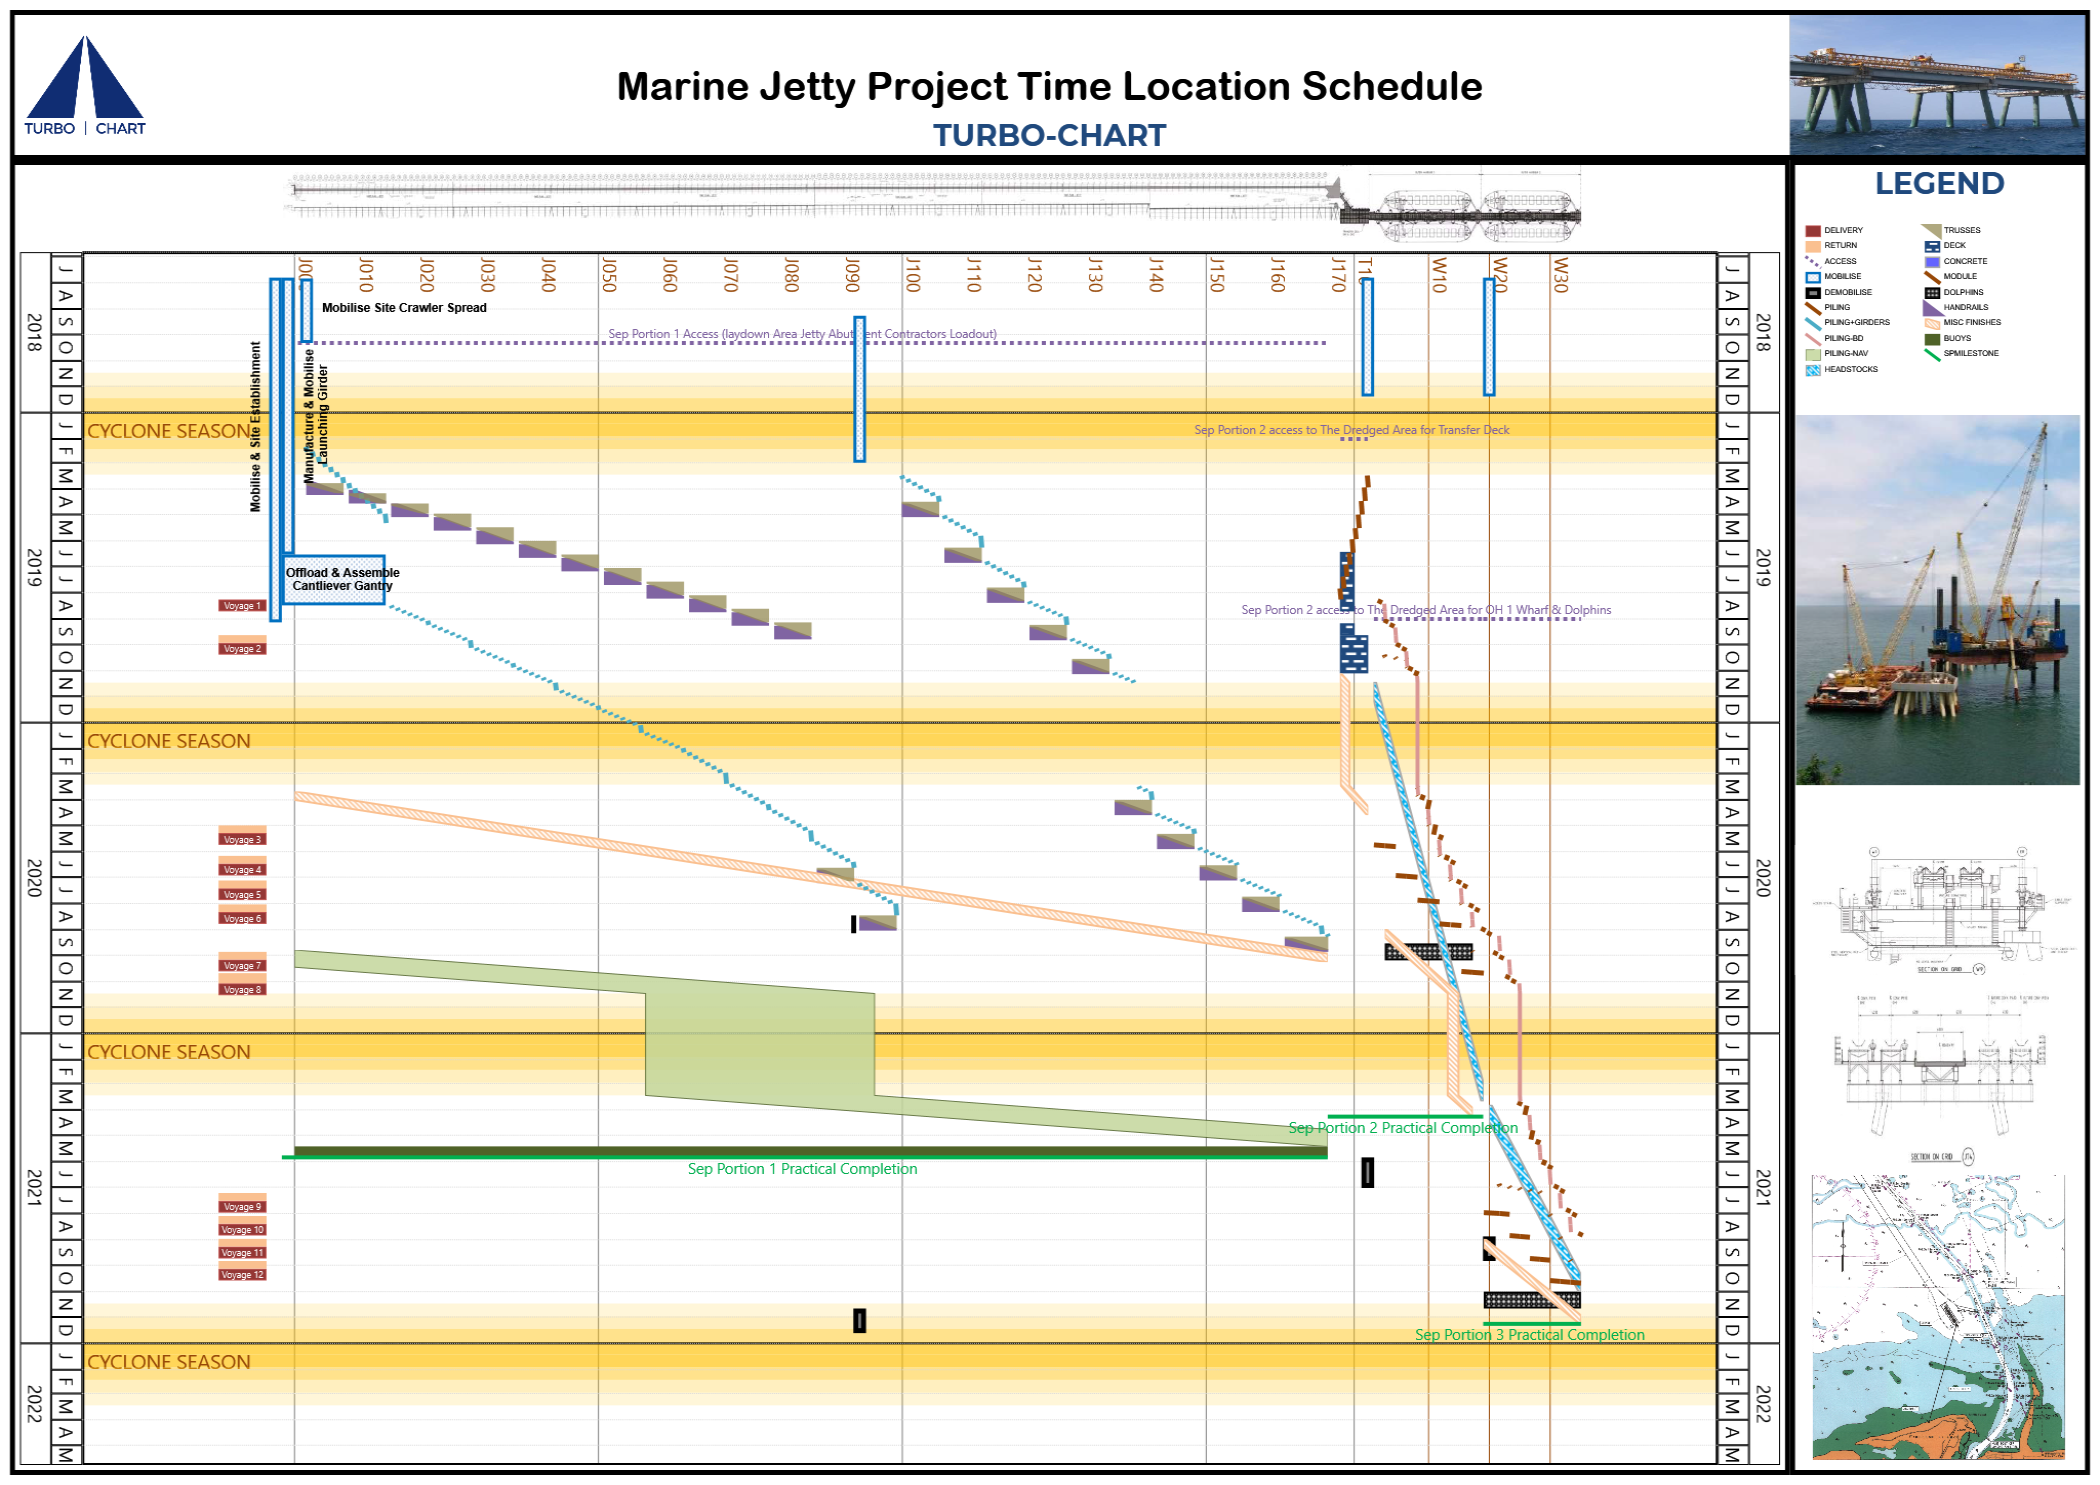
In this chart example, date Highlighter regions have been used to highlight seasonal periods across specified date ranges and Location highlighter lines have been used to highlight key points along the location axis.
Watch our Quick Tips #3 Video on using Highlighters to create custom grid lines here
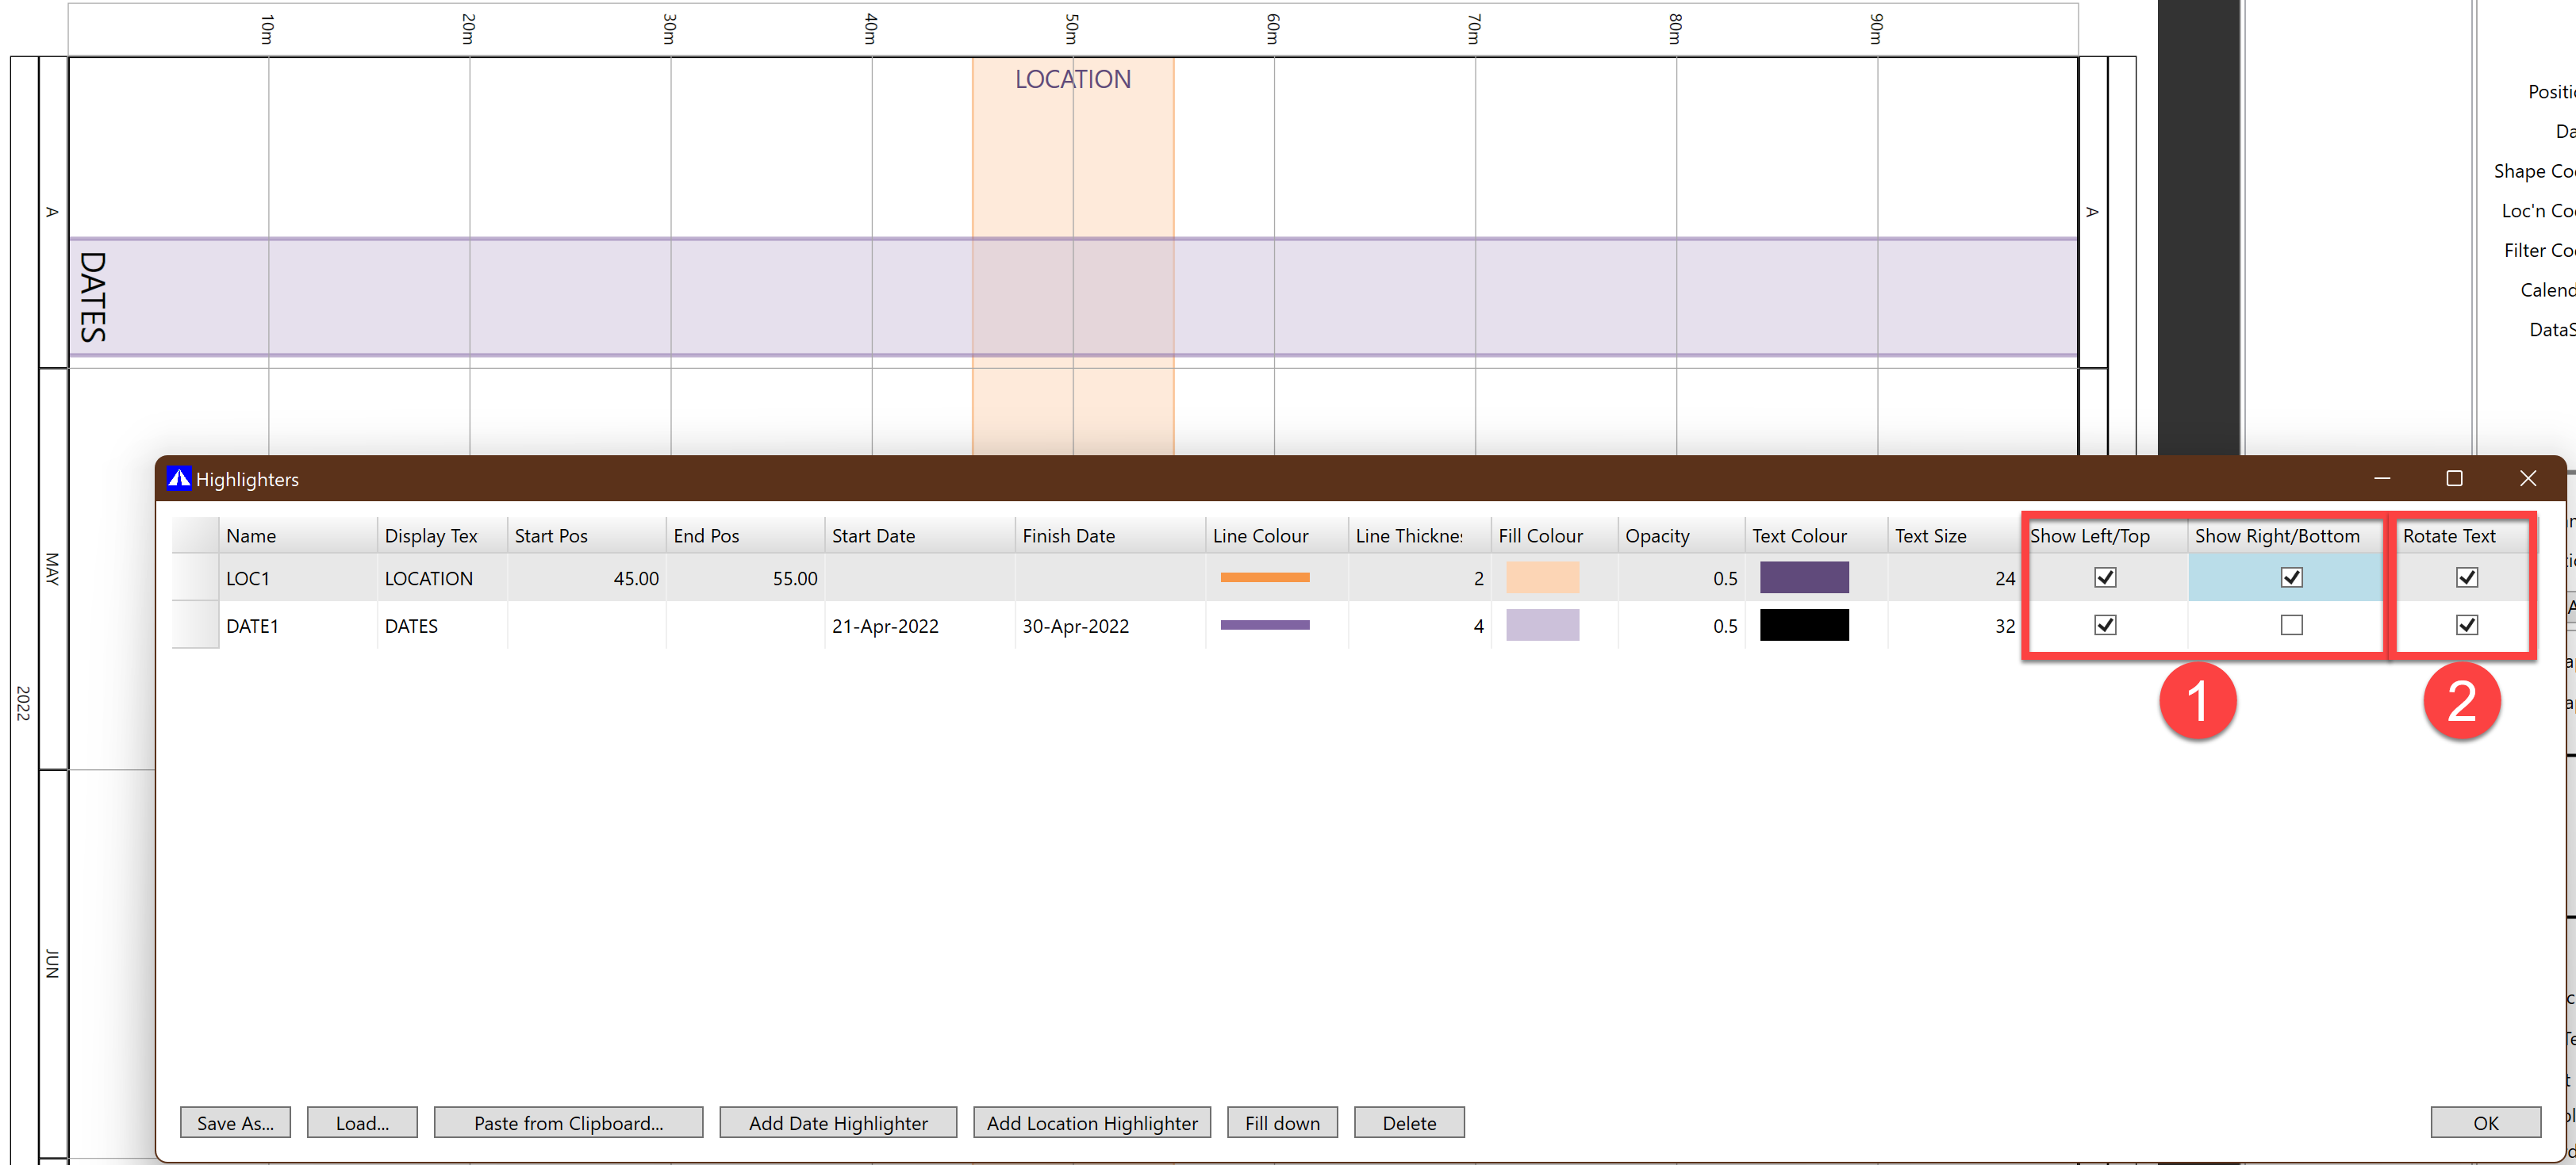
Release v2.0.7.1 of Turbo-Chart now offers additional controls for each highlighter.
1. Highlighter Display Text can now be chosen to be displayed on either side of the chart, where previously only the top or left side was displayed
2. Highlighter display text can also be rotated to align with the axis text, previously the text was drawn parallel to the highlighter line.
Existing highlighters will stay as they were (only left or top) and any new highlighters will default to showing text at both locations
3. The Highlight dialog is now modeless allowing you to keep the dialog open and see your edits as you make them.
4. The active highlighter is now shown with a green border to make it easier to see which highlighter is selected in the dialog.