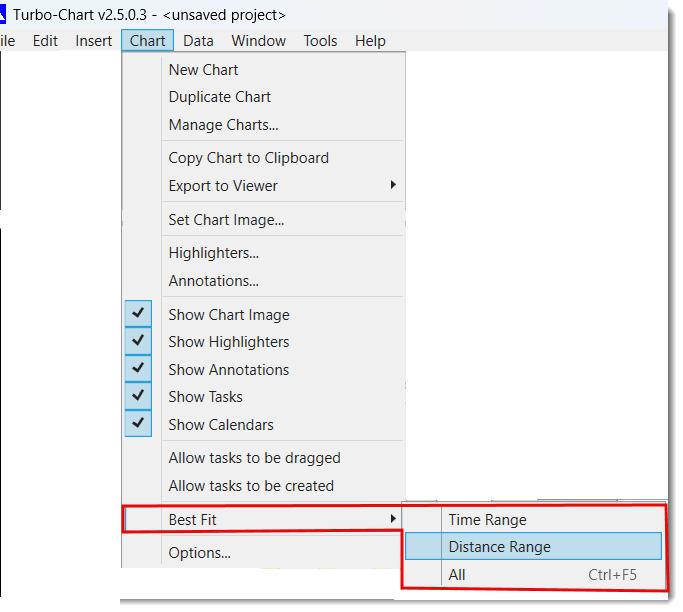
Each chart within Turbo-Chart can have a defined start to end date range, and a defined start to end location range. Turbo-Chart can also auto-fit to the match the minimum and maximum values in the dataset being displayed.
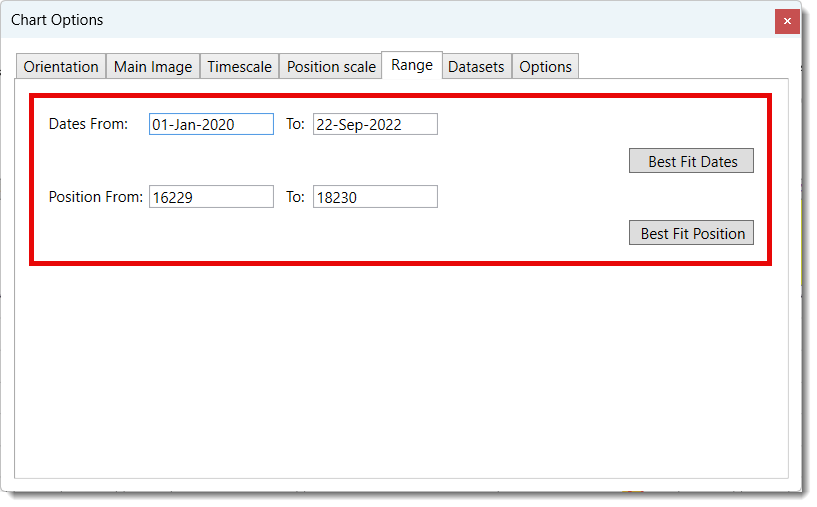
In releases earlier than v2.5 of Turbo-Chart, the range and auto-fit options are found in the CHART>CHART OPTIONS menu item, and moving to the Range tab:
From v2.5 onwards, ranges are set within the tabs for TimeScale and Position Scale:


Best fitting can also be selected from the CHART menu or pressing CTRL+F5 to best fit both dates and locations: