
Turbo-Chart Location Code Display Update
The v2.1.0.3 update of Turbo-Chart improves the presentation of location codes along the location axis on Time Location charts.
Turbo-Chart Location Code Overview
Location codes are text values assigned to tasks that allow positioning of the task on the location axis of Time Location Charts. Turbo-Chart uses a Task Location library (Access from DATA>TASK LOCATION LIBRARY on the menu) to assign start and end values based on the location code assigned to tasks. Location Codes may be helpful if exact start/end locations are not used, or are changing rapidly as it requires less maintenance of the task data in scheduling applications.
NOTE if a task has location start & end values AND also contains a location code, the Task Location Library values will override the task locations start and end values.
In addition, Location codes can be used to display text referencing the locations, in a hierarchical format adjacent to the location axis, to assist with communicating and understanding the schedule data.
The diagram below indicates the use of Location Codes:
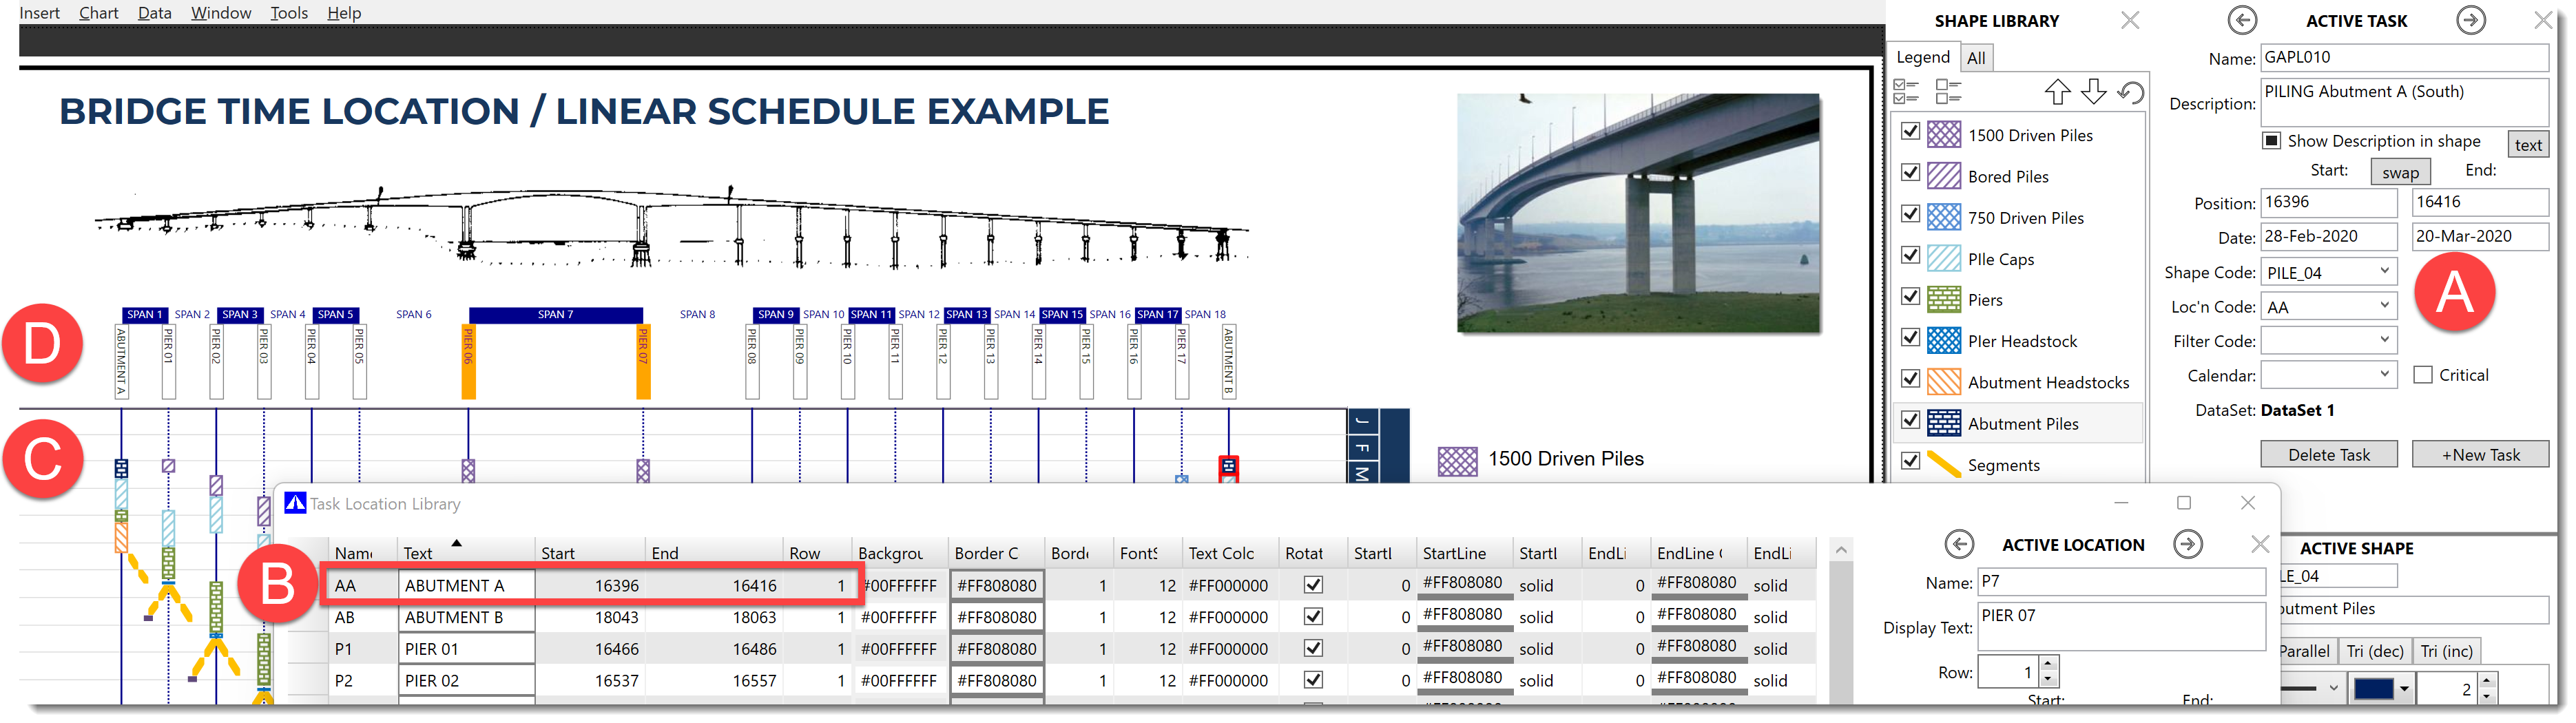
A) Tasks are assigned Location Codes, either within Turbo-Chart or from source Schedule Data
B) The Tasks Location Library lists all location codes from the Task data and sets options for the location code, including start/end values, and formatting options for displaying adjacent to the location axis
C) The task is positioned on the Time Location chart by the start/end values specified in the Task Location Library
D) The selected rows of Location Codes with their display formats can also be displayed adjacent to the location axis, even when the location axis is rotated vertically.
Turbo-Chart can display two types of grid displays for the location axis on charts. The Automatic scale is used to draw a gridline at regular spaced intervals (eg. every 100units). The Location Grid displays grid lines for each location code item for selected Rows of the Location Library.
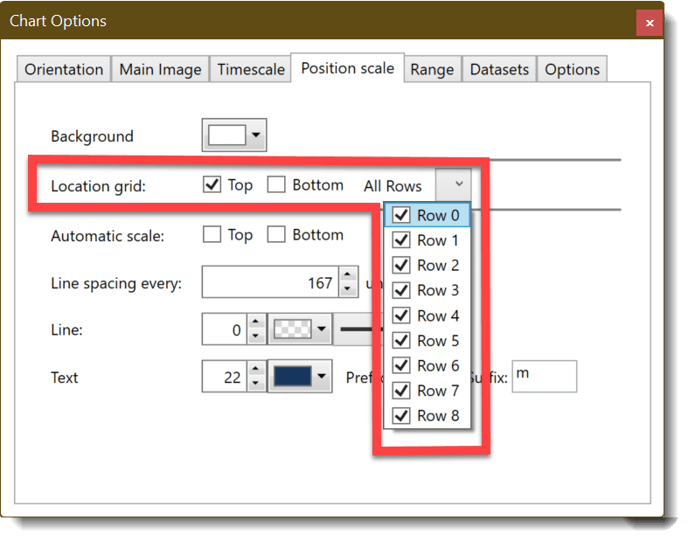
To enable either of these location grids, select CHART>CHART OPTIONS>POSITION SCALE and enable re required options
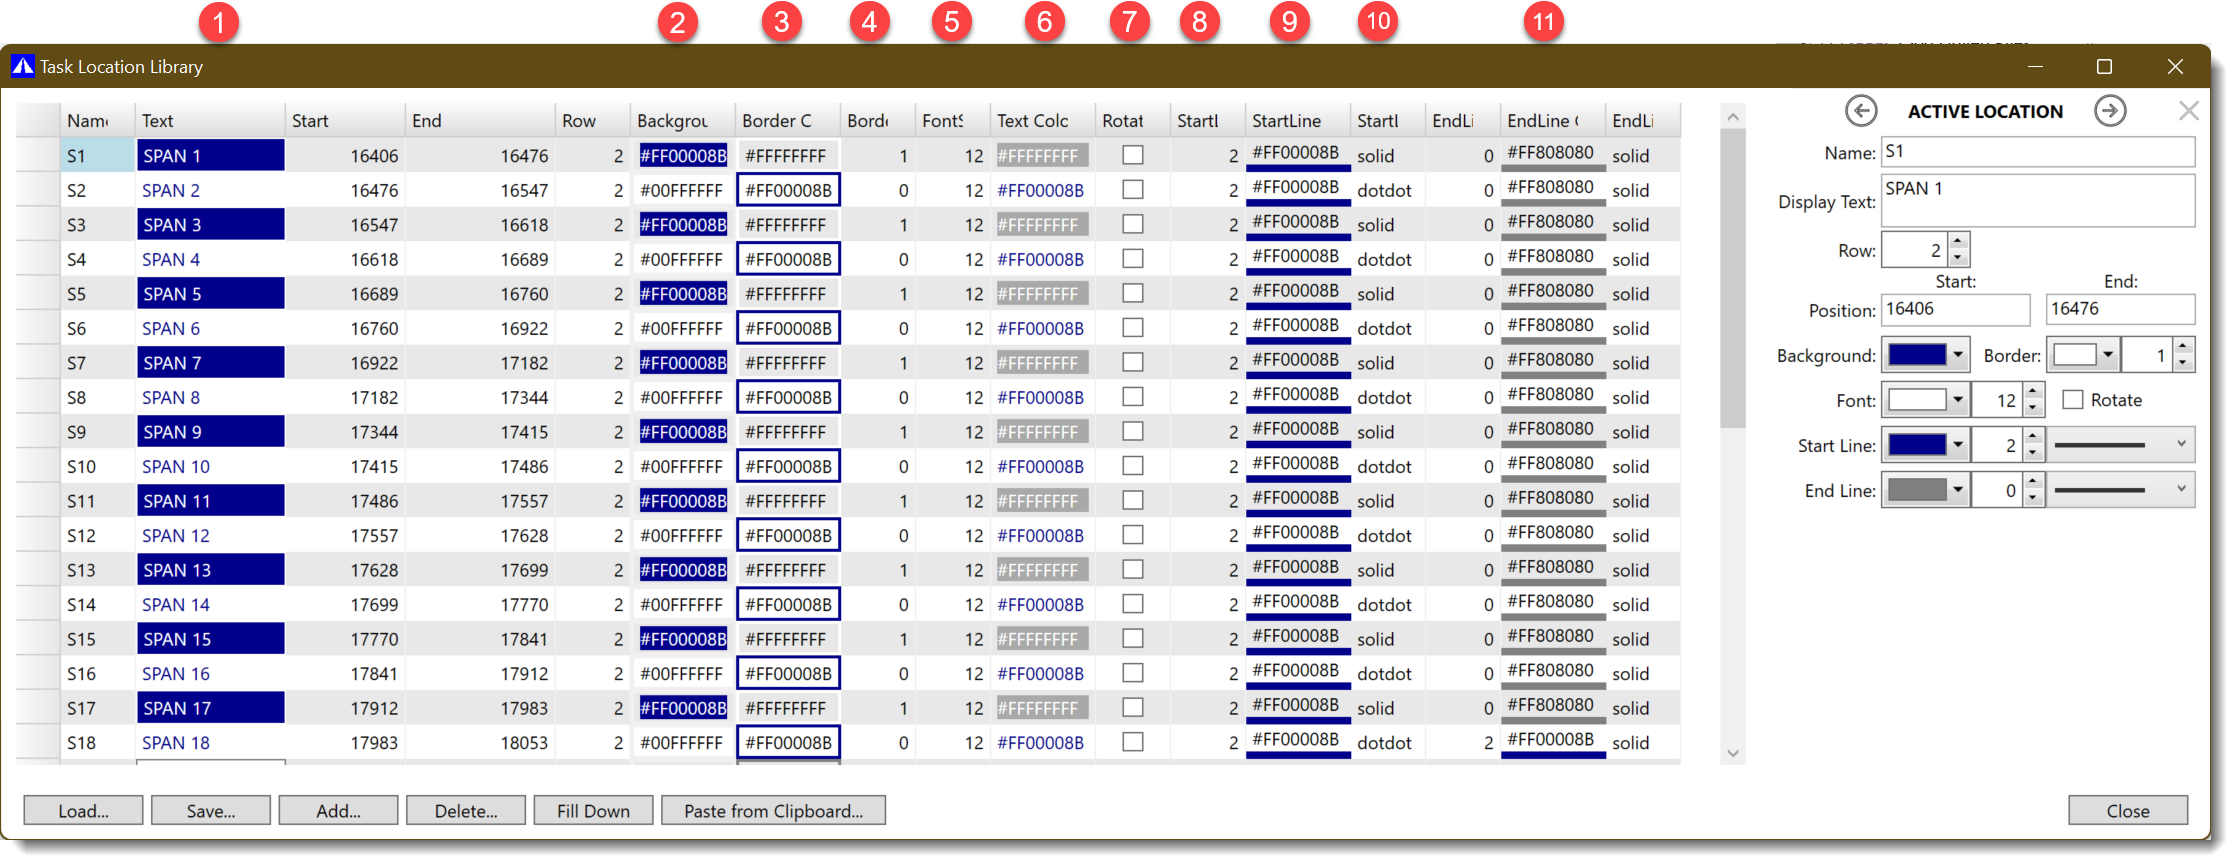
Release v2.1.0.3 of Turbo-Chart now offers additional controls for displaying location codes along the location axis.
1. The location code library is accessed from DATA>TASK LOCATION LIBRARY from the menu. Location codes and grids are common across all charts with a Turbo-Chart file.
2. The Location Code Library now contains an Active Location panel that displays the details and formatting for a selected Location Code

3. Additional formatting options are now available for each Location Code item:
- A preview of the text display
- Formatting the background of the location code cell
- Formatting the border colour of the location code cell
- Setting the thickness of the location code cell border
- Set the font size of the location code text
- Set the font colour
- Rotate the location code text
- Set thickness of the grid line drawn at the start of the location code value
- Set the colour of the grid line drawn at the start of the location code value
- Set the appearance (Solid, dash etc) of the grid line drawn at the start of the location code value
- Set the thickness, colour and appearance of the grid line drawn at the end of the location code value
For all the colour values in the Task Location Library, values may be entered in Hexadecimal Colors ie #RRGGBB or as HTML Color Names, eg:
- Red
- DarkBlue
- LightSkyBlue
- A full list of the 140 HTML Color Names can be seen at the w3schools Website
4. The Task Location Library window is now modal, and changes made in this window are automatically refreshed on the chart view instantly
5. All values in the Task Shape Library can be copied and pasted into a spreadsheet:
- Select the top left cell of the table to select all data
- CTRL+C to copy to clipboard and Paste into spreadsheet to populate further.
- Select all data from the spreadsheet including the headers and CTRL+C to copy data to clipboard
- In the Task Location Library window, click on Paste from Clipboard
- NOTE when pasting from clipboard, the entire data table is overwritten.