
Try Turbo-Chart right now!
Download Turbo-Chart now with your MS Project schedule, Primavera P6 , Safran Project or any spreadsheet capable data tool.
To use this feature, follow these simple steps
1 ) In MS Project, add the following columns for additional data, and save your file
- Two Number Fields to enter the Location Start and Location End values
- A Text Field to enter ShapeCodes, these will be used to define how each task appears on the Time Location chart.
2) Launch Turbo-Chart, Select, File > Microsoft Project > Add Microsoft Project and locate yours MS Project file
3) Map the import to the additional fields created above
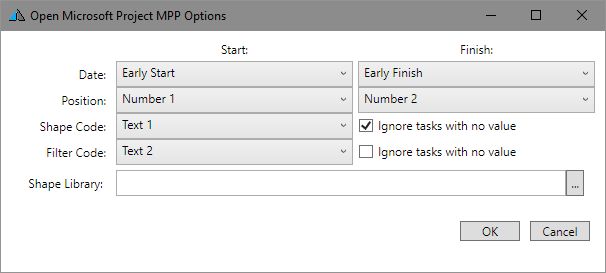
4) Press OK and your schedule data is imported. Press Ctrl+F5 to view the full range of locations and dates imported.
5) Click on the ShapeCode values in Shape Library pane to customise your Shape Library
7) Modify chart options by selecting Chart > Chart Options
6) As you make changes in MS Project, Save the file and In Turbo-Chart Press CNTRL+R (or File > Re-Sync from source) to view the schedule changes.
7) Additional projects, or comparisons can be made by importing data into new datasets (Data> Data Sets)