
These types of projects occur in many industries including linear infrastructure projects and go under various names such as:
- Possessions
- Occupations
- Shutdowns
- Turnrounds
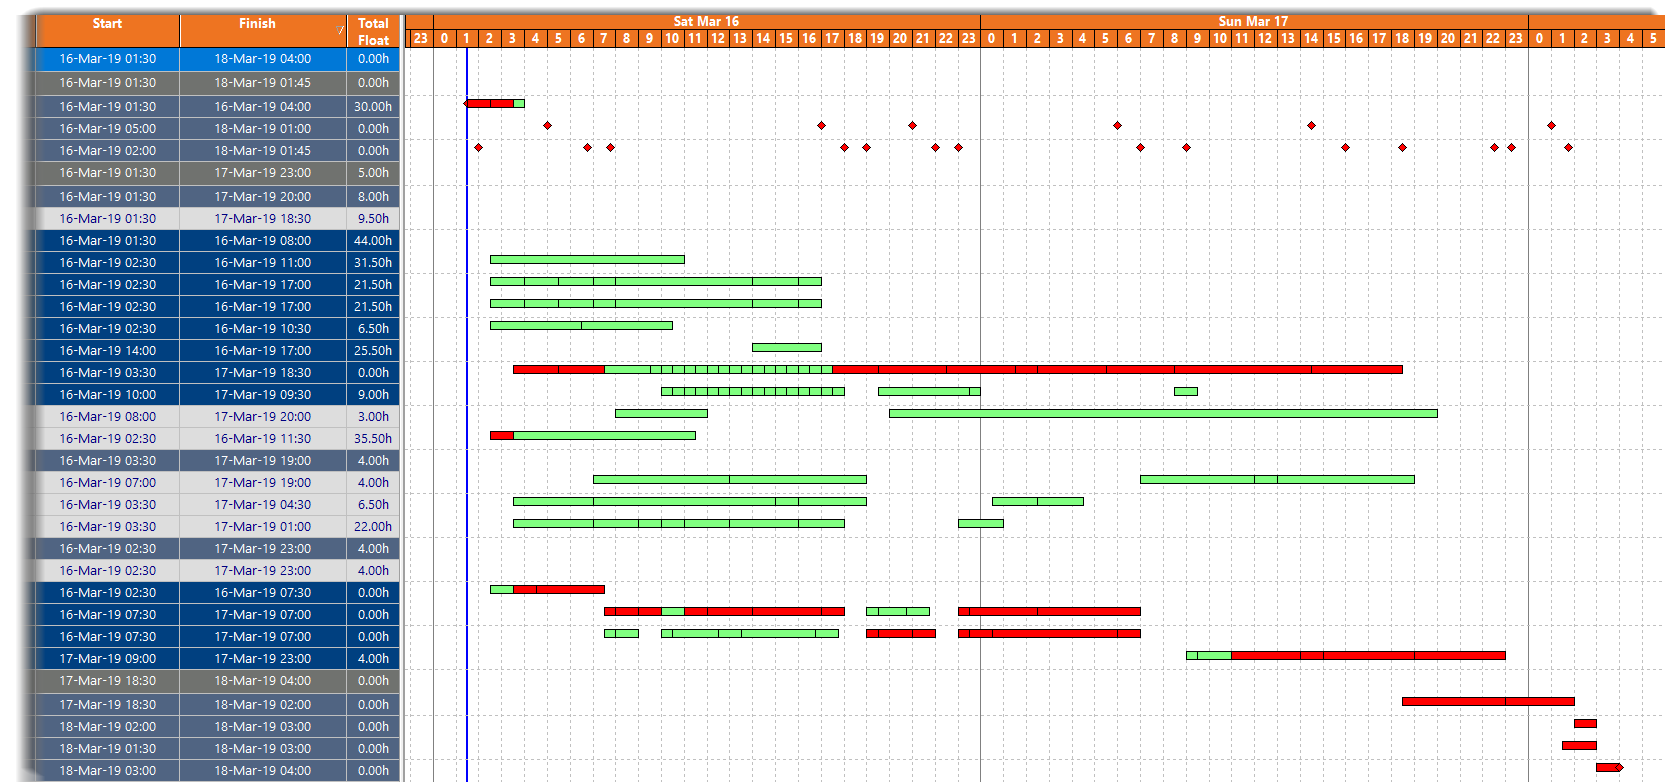
For such projects, schedule tasks can be planned and scheduled down to minute level precision, now Turbo-Chart can also be used to graphical display these short duration projects, following a new feature introduced in release v2.0.1.0.
Turbo-Chart Highlighters
As well as grid lines at regular spacing and time periods, Turbo-Chart’s highlighters feature also lets charts contain custom grid lines and/or bands at user specified locations and dates. Now, when using using day units for the timescale, Highlighters can be drawn down to a minute level, allowing short duration projects to have grid lines displayed each hour, quarter hour, at a set number of minutes, and/or any non-repeating time periods.
The steps below will demonstrate how:
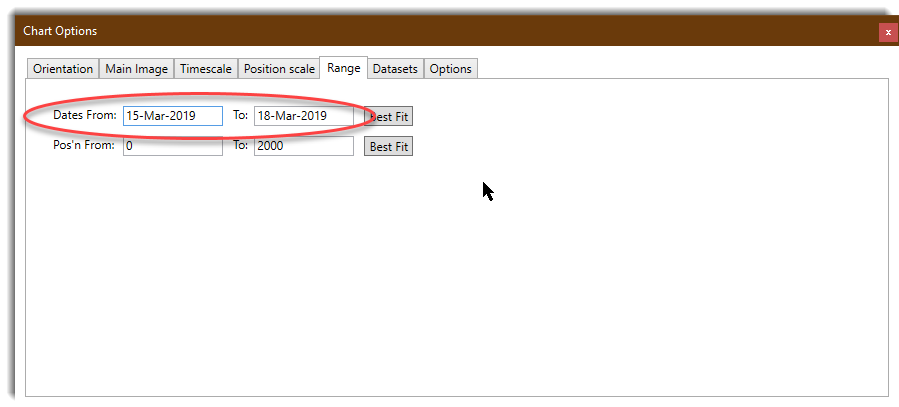
Set Date Range
First set the date range to be displayed on the chart for the short duration project by selecting CHART>CHART OPTIONS>RANGE
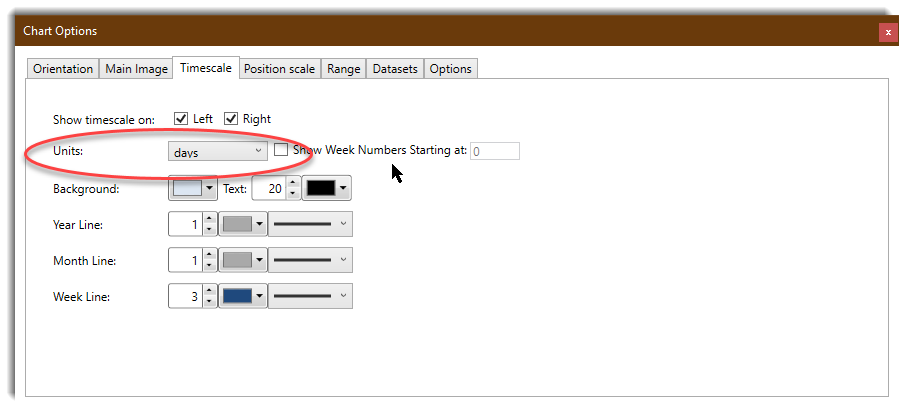
Set Timescale Units
Select the timescale units to be used for the chart by selecting CHART>CHART OPTIONS>TIMESCALE, in this case select DAYS. Note this enables tasks to be imported into Turbo-Chart and displayed down to minutes ie – dd-mmm-yy hh:mm format.
Create Highlighters for Time Gridlines and Bands
Select CHART>HIGHLIGHTERS from the menu, and create highlighter time gridlines or bands
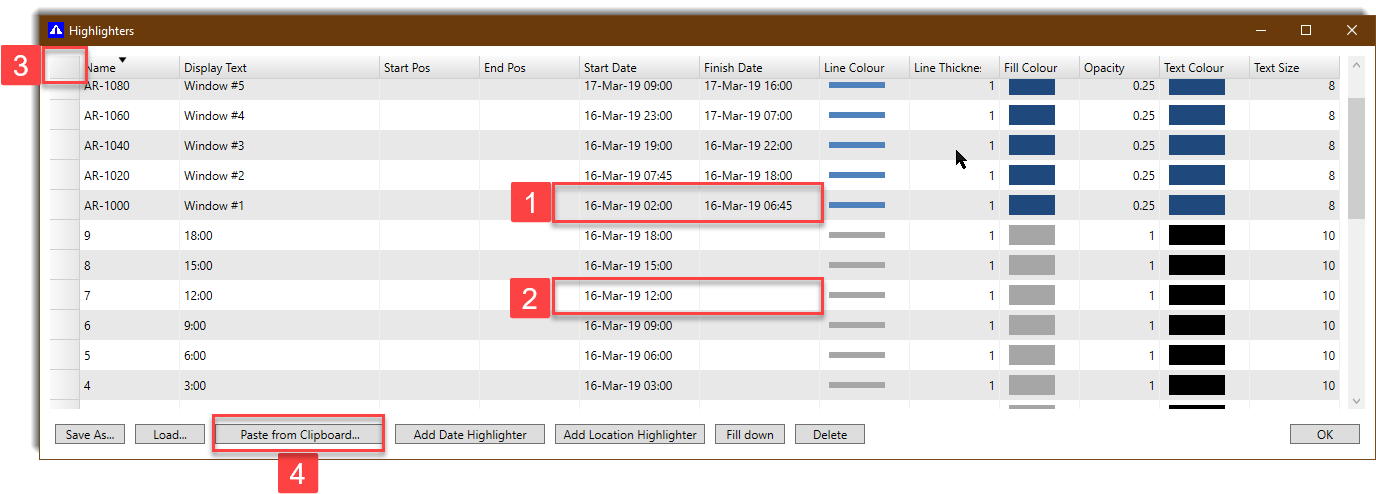
Notes on Highlighters
- Create Highlighter bands by including both Start and Finish Dates in dd-mmm-yy hh:mm format..
- Create single gridlines at specified date and time, by leaving the Finish Date cell blank
- Select the top left cell of the table and press CTRL+C to copy the data to clipboard, and paste to excel as a template for further populating
- Copy a table of highlighters from Excel (including headers) and select Paste from Clipboard to paste and overwrite existing highlighters
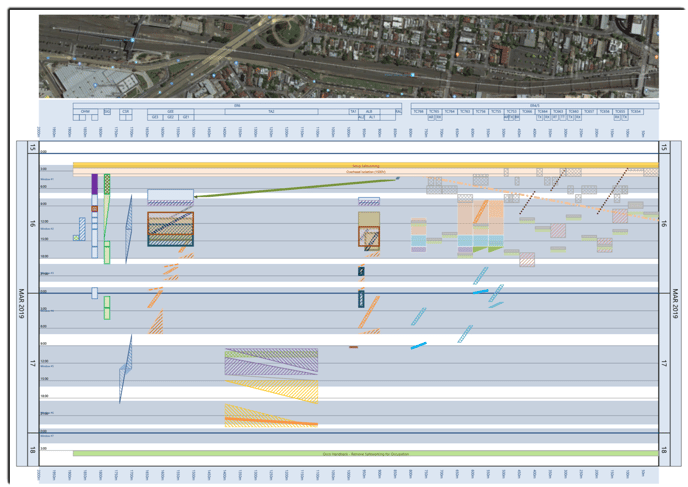
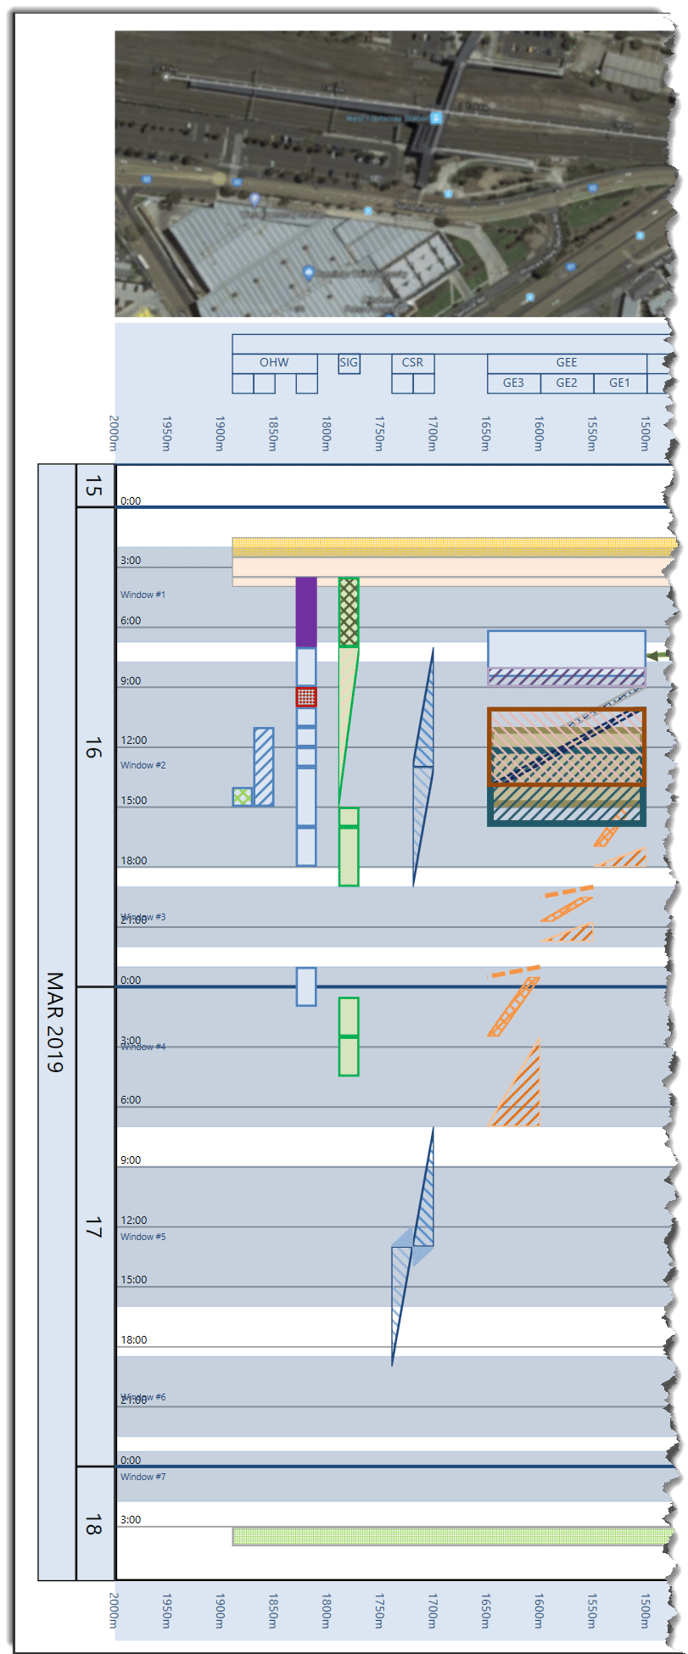
Resultant display
By using Highlighters, key times and time periods can be displayed on the Time Location / Linear Schedule chart, displaying:
- Commencement and Completion times
- Available or non-available work period windows
- Grid lines for times at any specified interval
Please Contact Us to receive a ZIP file containing the data shown in this article:
- Short Duration Highlighters File.tchiliter is a Turbo-Chart Highlighter file that can be opened within Turbo- Chart from the CHART>HIGHLIGHTERS menu
- Short Duration Highlighters Spreadsheet.xlsx is an Excel spreadsheet file that be copied and pasted into Turbo-Chart using the Paste From Clipboard option