
Physical printouts and PDFs are great for sharing a one-page view of your project schedule and showing the big picture, but they are static and lack the ability to focus on specific activities or types of work.
The Turbo-Chart Interactive Viewer (available from v2.2.0.1 onwards), is a new (FREE) way to share your chart so that others can easily explore the detail of your chart without installing any software or needing to learn how to use Turbo-Chart.
Generated as a single .html file, it is easy to share via email, save on a shared drive or even embed into a dashboard or web portal.
How it works
Using Turbo-Chart, select the chart you want to export to the viewer format.
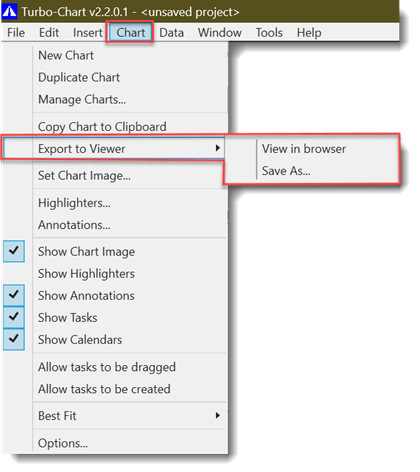
From the Chart menu, choose “Export to Viewer” To see how it works, just select “View in browser..”, but if you actually want to create a *.html file choose “Save As…”
Wait a few moments, while the layers for each ShapeCode displayed on the chart are generated, and that’s it!
The chart should open in your default
browser.
Using the Interactive Viewer
Once the viewer file is generated, we hope it is intuitive enough not to need any special training.
Each ShapeCode on your chart is added as a layer to the viewer.
Using a simplified legend with checkboxes, the person viewing can add or remove the layers to explore each ShapeCode.
You’ll see that you can hide/show the menu with the button in the top left, and the checkall and uncheckall buttons are self explanatory.
As you mouse over the shape codes, they automatically appear on the chart, making it easy to add the layer you want to see. Notice that the file locations and create time are shown in the footer for your reference.
Tips for producing your chart
Print Preview mode affects how the chart appears, so remember you can include the legends and company details (title etc) if needed.
The Viewer always looks the way you have it set up – so remember to get the zoom levels right for your audience..If additional datasets are being shown, they will also appear on the chart and will be turned on and off with the selected layers.
DataSets/Critical path etc cannot be controlled from the viewer.
Nor can you hover over each task for a tooltip… if you need to do this you need the full version of Turbo-Chart.
Note: All Tasks’ ShapeCodes that are visible “on chart” will be included in the layers for the viewer – regardless of whether you included them “in legend”.
Sample Interactive Viewer
Visit the Interactive Viewer with our Sample Charts Online here